

Task 1 Trend and Comparison Practice
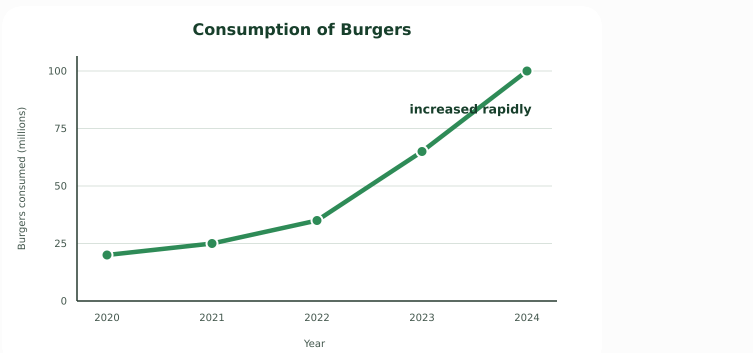
The consumption of burgers increased rapidly from around 20 million in 2020 to 100 million in 2024.
Practice Pattern
The consumption of increased rapidly from in to in .
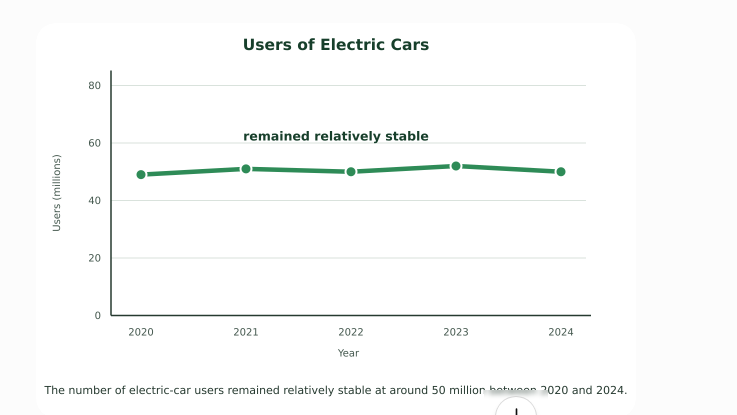
The number of electric-car users remained relatively stable at around 50 million between 2020 and 2024.
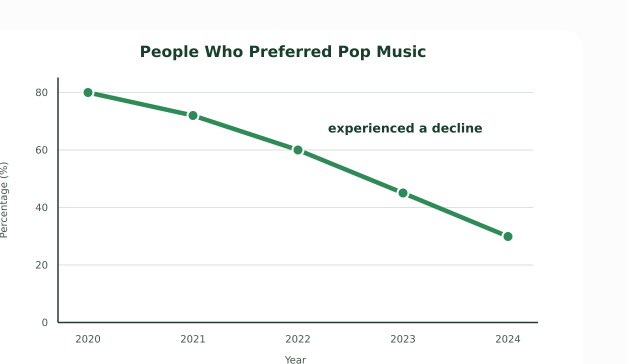
The percentage of people who preferred pop music declined rapidly from 80% in 2020 to around 30% in 2024.
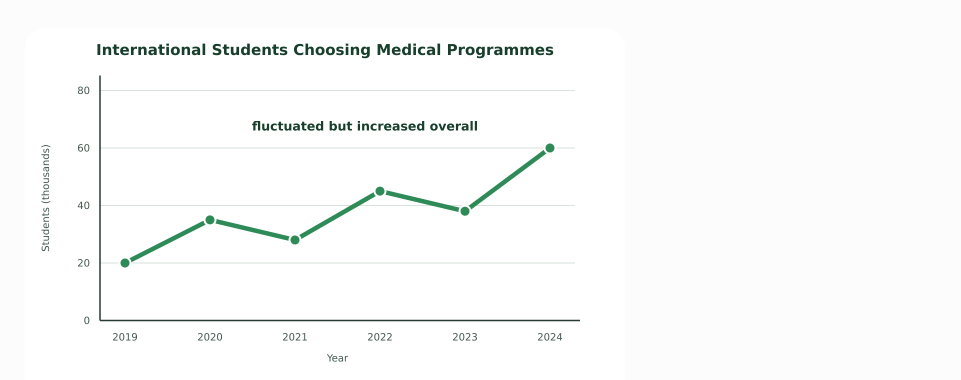
The number of international students choosing medical programmes fluctuated but increased overall from 20,000 in 2019 to 60,000 in 2024.
Look at the Bar Graph carefully & write your sentences.
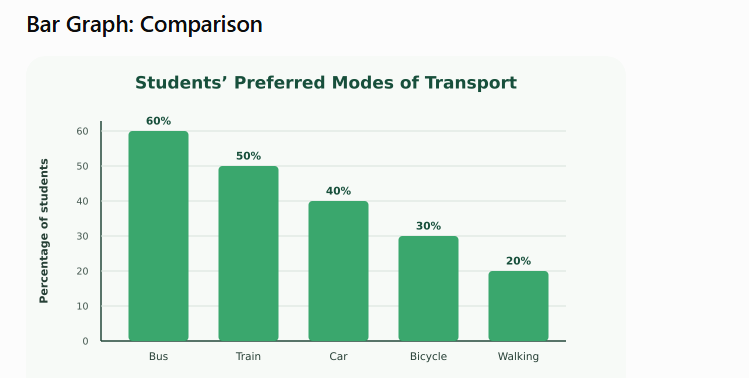
Easy Sentence Pattern for a Bar Graph
1. Bus was the most popular mode of transport, at 60%.
2. This was followed by train and car, at 50% and 40%, respectively.
3. Bicycle was chosen by 30% of students, while walking had the lowest figure, at 20%.
4. Bus was three times as popular as walking.
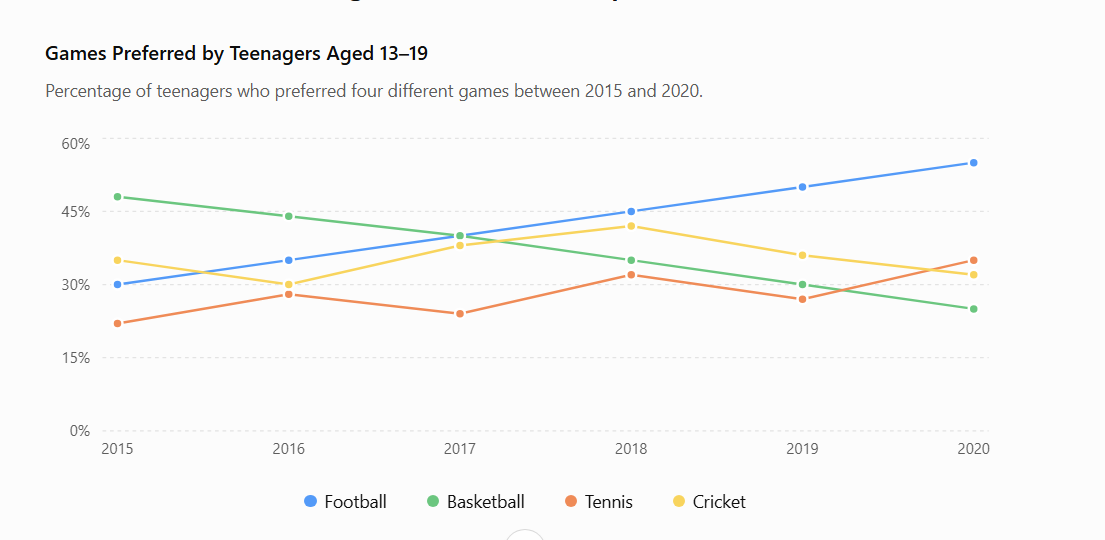
The line graph shows the percentages of teenagers aged 13–19 who preferred four different games between 2015 and 2020.
Summarise the information by selecting and reporting the main features, and make comparisons where relevant.
Line Graph — Model Answer
Introduction The line graph illustrates the percentages of teenagers aged 13–19 who preferred four different games, namely football, basketball, tennis and cricket, between 2015 and 2020.
Overview Overall, football became increasingly popular among those in the 13–19 age group and recorded the highest percentage by 2020, whereas basketball showed a steady decline. By contrast, the preferences for tennis and cricket fluctuated throughout the period.
Body Paragraph 1 In 2015, basketball was the most popular game among 13- to 19-year-olds, with 48% preferring it, compared with 30% who chose football. However, the proportion choosing basketball fell steadily to 40% in 2017 and then decreased further to 25% in 2020. Football followed the opposite trend, as the percentage of young people choosing this game increased steadily from 30% in 2015 to 55% in 2020.
Body Paragraph 2 Turning to the other two games, 22% of teenage participants preferred tennis in 2015. This figure rose to 28% in 2016 before falling slightly to 24% the following year. It then fluctuated before reaching 35% in 2020. Similarly, the proportion opting for cricket initially fell from 35% to 30% before climbing to a peak of 42% in 2018. After that, it declined and stood at 32% in 2020.
Why We Group Them This Way • Football + Basketball: Opposite clear trends — one rises while the other falls.
• Tennis + Cricket: Both show fluctuations, so they can be compared naturally in the same paragraph.
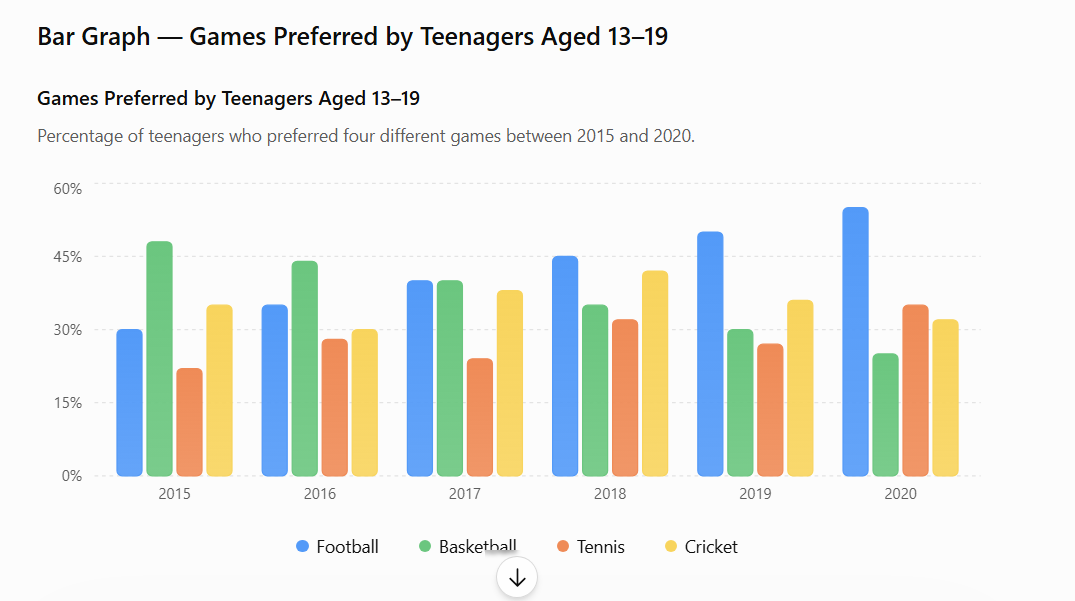
The bar chart illustrates the percentages of teenagers aged 13–19 who preferred four different games, namely football, basketball, tennis and cricket, between 2015 and 2020.
Summarise the information by selecting and reporting the main features, and make comparisons where relevant.
Write at least 150 words.
Bar Graph — Model Answer
Introduction The bar graph illustrates the percentages of young people aged between 13 and 19 who preferred four different games, namely football, basketball, tennis and cricket, between 2015 and 2020.
Overview Overall, football became increasingly popular among those in the 13–19 age group and recorded the highest percentage by 2020, whereas basketball showed a steady decline. By contrast, the preferences for tennis and cricket fluctuated throughout the period.
Body Paragraph 1 In 2015, basketball was the most popular game among 13- to 19-year-olds, with 48% preferring it, compared with 30% who chose football. However, the proportion choosing basketball fell steadily to 40% in 2017 and then decreased further to 25% in 2020. Football followed the opposite trend, as the percentage of young people choosing this game increased steadily from 30% in 2015 to 55% in 2020.
Body Paragraph 2 Turning to the other two games, 22% of teenage participants preferred tennis in 2015. This figure rose to 28% in 2016 before falling slightly to 24% the following year. It then fluctuated before reaching 35% in 2020. Similarly, the proportion opting for cricket initially fell from 35% to 30% before climbing to a peak of 42% in 2018. After that, it declined and stood at 32% in 2020.
The table shows the percentages of teenagers aged 13–19 who preferred four different games in 2015 and 2020.
Summarise the information by selecting and reporting the main features, and make comparisons where relevant.
Write at least 150 words.
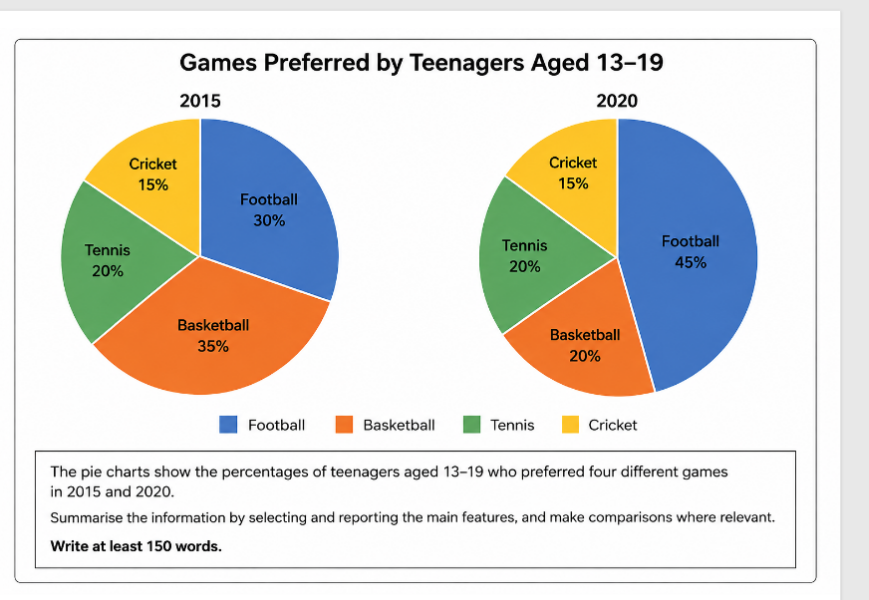
The pie charts compare the preferences of young people aged between 13 and 19 for four different games, namely football, basketball, tennis and cricket, in 2015 and 2020.
Overall, football became considerably more popular among those in the 13–19 age group and represented the largest proportion in 2020, whereas basketball experienced a noticeable decline. In contrast, the percentages choosing tennis and cricket remained unchanged.
In 2015, basketball was the most popular game among 13- to 19-year-olds, accounting for 35%, while 30% preferred football. However, the proportion of young people choosing basketball fell significantly to 20% in 2020. Football followed the opposite pattern, with the percentage preferring this game rising by 15 percentage points to 45%, making it the most popular choice in the later year.
Turning to the remaining two games, 20% of young people in this age group preferred tennis in 2015, and this figure remained unchanged in 2020. Similarly, the proportion choosing cricket stood at 15% in both years, showing no change over the period.
The table shows the percentages of teenagers aged 13–19 who preferred four different games in 2015 and 2020.
Summarise the information by selecting and reporting the main features, and make comparisons where relevant.
Write at least 150 words.
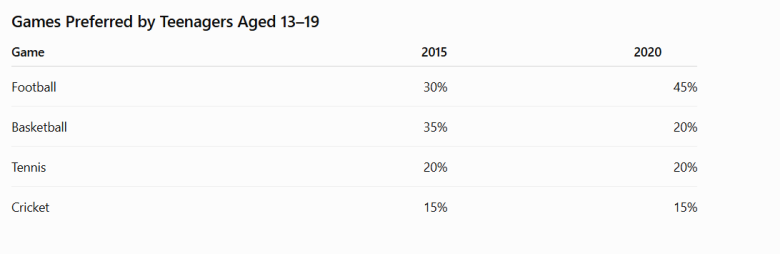
Table — Model Answer
Introduction The table compares the percentages of young people aged between 13 and 19 who preferred four different games, namely football, basketball, tennis and cricket, in 2015 and 2020.
Overview Overall, football became considerably more popular among those in the 13–19 age group and recorded the highest percentage in 2020, whereas basketball experienced a noticeable decline. In contrast, the percentages choosing tennis and cricket remained unchanged.
Body Paragraph 1 In 2015, basketball was the most popular game among 13- to 19-year-olds, accounting for 35%, while 30% preferred football. However, the proportion of young people choosing basketball fell significantly to 20% in 2020. Football followed the opposite pattern, with the percentage preferring this game rising by 15 percentage points to 45%, making it the most popular choice in the later year.
Body Paragraph 2 Turning to the remaining two games, 20% of young people in this age group preferred tennis in 2015, and this figure remained unchanged in 2020. Similarly, the proportion choosing cricket stood at 15% in both years, showing no change over the period.
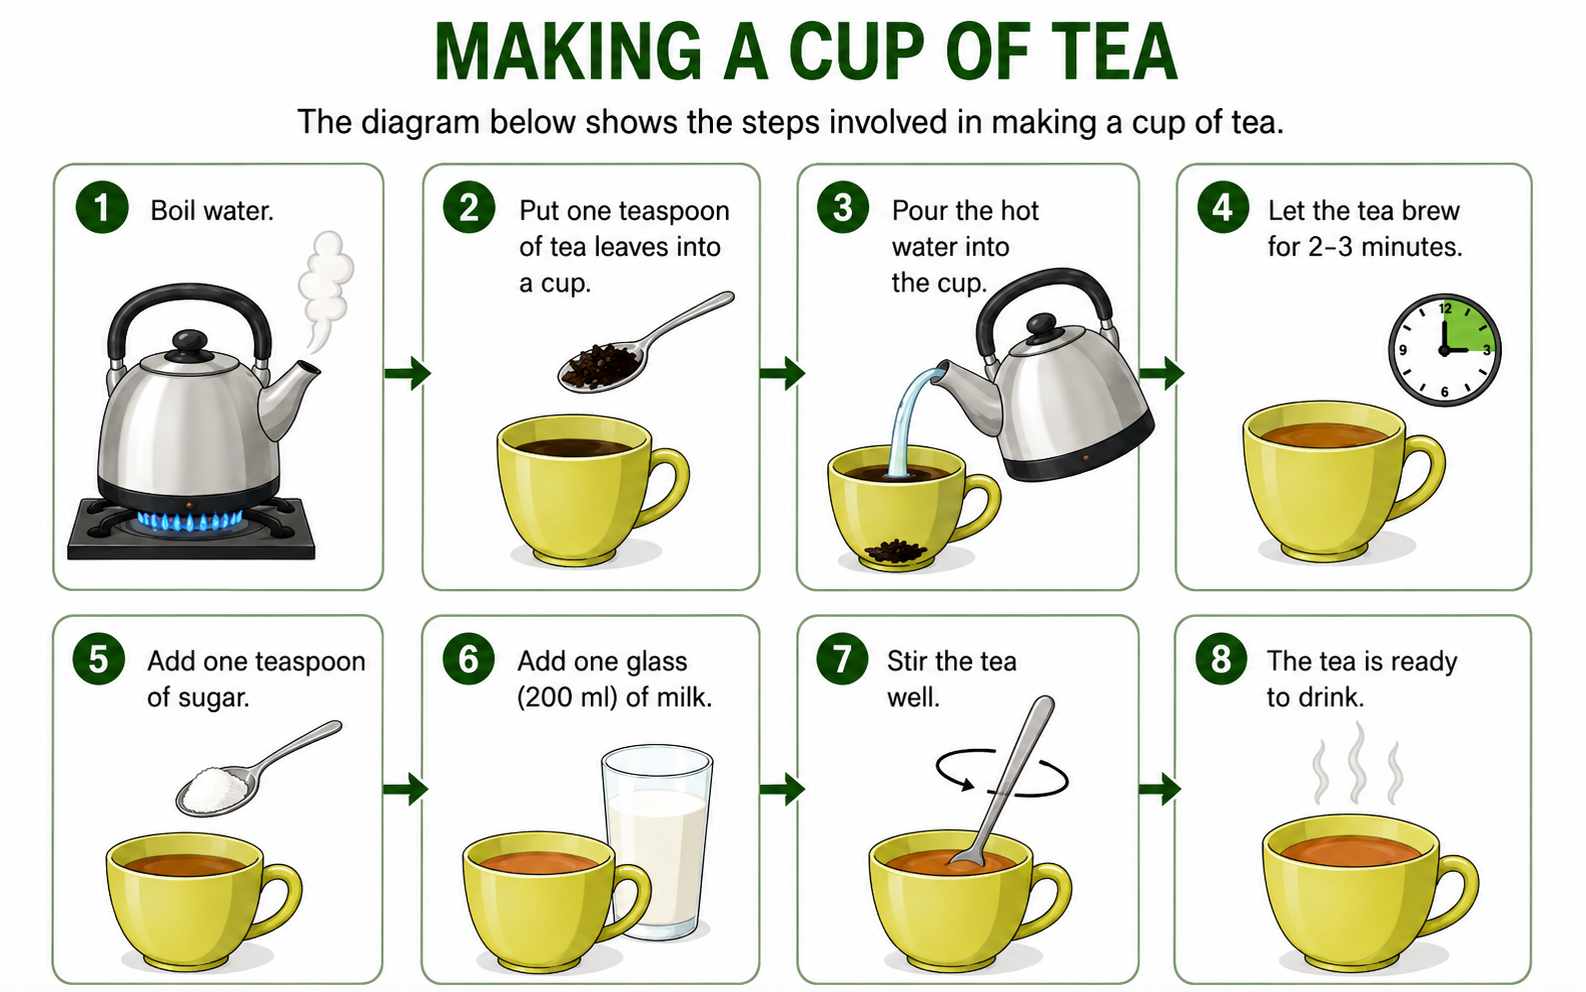
The diagram below shows the process of making a cup of tea.
Summarise the information by selecting and reporting the main features, and make comparisons
where relevant.
Process Diagram — Model Answer
Introduction The diagram illustrates the process involved in making a cup of tea.
Overview Overall, it is a man-made process consisting of eight stages, beginning with boiling water and ending with the prepared tea being ready to be served.
Body Paragraph 1 Initially, water is boiled in a kettle. Next, one teaspoon of tea leaves is placed into a cup. Once the water has reached boiling point, it is poured into the cup containing the tea leaves. The tea is then left to brew for approximately two to three minutes.
Body Paragraph 2 Following this, one teaspoon of sugar is added to the tea. In the next stage, one glass (200 ml) of milk is poured into the cup. The tea is then stirred thoroughly so that the ingredients are mixed together. Finally, after the sugar and milk have been added to the brewed tea, it is ready to be served.
Stay on the exam screen
A tab or full-screen change was detected and recorded.
How to complete this exercise
Study each visual, write your response in the box beside it, then submit when you are ready.
You’re about to leave the exam
Choose whether to discard this attempt and restart later, or save it and continue from the same place.
Submit this exercise?
Your answers cannot be changed after submission.